
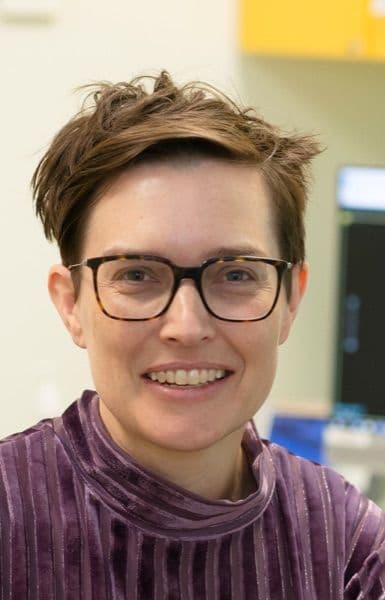
Dr Katherine Howell
Clinician-Scientist Fellow and the Epilepsy Team Leader at the Murdoch Children’s Research Institute, and a paediatric neurologist and epileptologist at the Royal Children’s Hospital.
Dr Katherine Howell is a clinician-scientist Fellow and the epilepsy Team Leader at the Murdoch Children’s Research Institute, and a paediatric neurologist and epileptologist at the Royal Children’s Hospital.
Watch the talk
The Impact of Developmental Epileptic Encephalopathies
In this compelling talk, Dr. Katherine Howell shares the findings of a comprehensive survey on the significant impacts of Developmental and Epileptic Encephalopathies (DEEs) on families. Highlighting both the challenges caregivers face and the gaps in healthcare systems, Dr. Howell emphasises the urgent need for improvements in care coordination, mental health support, and healthcare accessibility for families managing DEEs. Key topics covered:
- The emotional, social, and financial toll of DEEs on families.
- Survey findings on caregiver burden, quality of life, and healthcare experiences.
- The importance of coordinated healthcare services and DEE nurse coordinators.
- Insights on work productivity, emergency service usage, and hospital admissions.
- Strategies to advocate for better support systems and healthcare improvements
This presentation provides a vital perspective on the lived experiences of families caring for children with rare genetic epilepsies and highlights practical solutions to address their needs.
Read the transcript
Today I’ve the task of giving maybe the most depressing talk. And I wanted to put that out there first, because I wanted to frame it with a message of hope as well. And the message of hope I guess is, so today we’re going to be talking about the impact of these conditions on families. And this is presenting the data from a survey we did, which some of you will have filled in. And I think the messages of hope I guess I wanted to give are, we hear you, and that we’re working to improve this. But also we now have a body of evidence together that is really important for us to be able to show other people what the impacts of these conditions and particularly show people like governments that we need changes and hopefully these data will get us some of the way to doing that.
The impacts of DEEs are many you all know them. Ingrid’s talked about some of them. And I’m going to leave the medical ones out of a lot of this and focus more on the impacts to life on families. And particularly quite a lot of this will be on parents and caregivers. And this work has been done by a number of us in the room. Both, medical professionals and people with lived experience led by Kris Pierce, other people from GETA, people from the Epilepsy Foundation all working together. We initially, in 2019, had a roundtable which was aiming to understand the current gaps in service provision. And from that, we realised we had a whole lot of work to do and embarked on a number of other things, some of which are being done under the auspices of the DEER program, Developmental and Epileptic Encephalopathy Research program, which Ingrid leads and which we have NHMRC funding for which is really aiming to improve care for people. And the survey I’m presenting the data on was done through, through that. And there’s a lot of people who’ve been involved who are listed up here.
Where were we at before this. There are a number of studies where people have looked at the impact of DEEs on people’s lives. Quite a lot of them, you can see some of the studies on the left are specifically done in people with Dravet syndrome, so just one subset of people with DEE. There are some that have been done in other conditions like CDKL5 or broader DEEs. Those ones really have focused on really purely on quality of life. Some of the Dravet Syndrome ones have been a bit more expansive and looked at things like caregiver burden and work productivity. But what we’re missing is the Australian context. There’s really very little data in Australia and also looking at the broader group of people with DEE and things like the work productivity and things like that. So things outside of quality of life.
We conducted a survey and that was completed by caregivers who were adults of people with developmental and epileptic encephalopathy or other genetic epilepsy of any age. People had to be resident in Australia and accessing the Australian healthcare system. Recruitment was online, people filled out the surveys online in their own time and they were all anonymous. Really, we’re looking at two separate things. One is what are the impacts of DEE, and the other is which health resources are people using, what’s their experience of them, and what are the priorities for improvement. So who were the people that filled these in? So when I’m talking about the impacts on DEE section we were talking about 58 parents had completed these. So as parents and caregivers, they actually all were parents. Predominantly they were mothers. We had five fathers. Most of the parents were aged between 40 and 65, but some outside that age group. About half were resident in Victoria. And most people had one child with a DEE, but there were some who had two. You will notice there’s one with none, and may wonder why that person is in there. There are actually quite a lot of genes which I guess considered epilepsy genes, but we’re now finding that some people don’t have epilepsy. And a lot of those people, I think, have the experience of really being outliers and not actually belonging in any community. If we split things in ways that are actually not inclusive and things like understanding their experiences is really important that we don’t leave them out too. So we actually allowed people who had a child with an epilepsy gene who didn’t have seizures to be involved. So there was one person there. Who were their children? They weren’t all children, but it was a median age of nine but age range up to 34. So you will notice that we don’t. Have that much in the way of adult data and that’s something that we’ll fix in the future. About a bit over a quarter, about 30 percent were people with Dravet syndrome. That’s quite useful because we can compare to some of the existing literature. But the majority did not have Dravet syndrome. About three quarters had a genetic cause identified and about a quarter had an unknown cause.
We asked people to note which symptoms were problems for their child. Problems I think might have beendeliberately interpretable in different ways. But most people had lots of different problems. This I guess is data that are pretty consistent with the literature which as it suggests that probably at least half of people have, up to five or more problems other than their epilepsy.
First of all, going to parent quality of life, for each of these things we looked at some validated scales, which is really important because we can compare across the literature. It’s also really important because we can attach some costs and health economic data to these type of surveys. So the first one’s called the EQ-5D-5L and some of you might be familiar with this. Anyone who was in Victoria and took their child for a COVID test at the Royal Children’s Hospital at any point during the pandemic would probably have had to fill one of these out as well. And so the first bit it asks you is this visual analog scale, which you can see on the right where you’re asked to rate your health on that day from zero to a hundred. What we found in our cohort was that the mean was 61. 7. Now what does that actually mean? Let’s put this into a bit of context. So looking at the literature in the cohort of people with Dravet Syndrome, that was one of the papers I mentioned earlier their reported number was 67, so reasonably comparable. But if we look at the Australian population norms the population norms are 78, 79. So it’s substantially lower than for people not caring for someone with a chronic condition. There are ways of converting these into, to data, as I mentioned, the economic stuff. They use a slightly different value, which takes things into account. But you can see the numbers were substantially lower than the population numbers. When you measure it that way as well.
So let’s break this down a little bit further because that measure looks at a number of other things. It looks at five domains of health as listed here. Each of these rows is proportions of people who gave different scores and they range from no problem up to extreme problems. The sort of dull looking colours are where there’s no or minimal problems and the bold ones are where there’s moderate or more of a problem and that’s the same for a number of other graphs that I’ll show you. So you can see as you’d expect that some things like mobility weren’t a problem for most parents being in the not older adult age group. But in contrast things like anxiety and depression and impact on usual activities were pretty marked. These kind of scales, though, don’t actually take into account a lot of things that are actually really important for families lives. And there was a study a couple of years ago that got together parents of people with DEEs. I think it was in the US and asked people which other things should we be measuring when thinking about quality of life. So we actually asked parents about these things as well. And you’ll notice that the bolder colours actually make up a much bigger proportion of the each line here, and that thing, so we’re looking at here the things that are missed by those other scales, so time for physical health, time with friends, sleep quality relationships, all of that kind of thing. So things that are critical to people’s lives but which we actually have a lot of trouble attaching value or even thinking about asking them and I think they’re incredibly important. So the impacts here and the numbers are pretty big, but how do this compare to other chronic health conditions? So this slide shows data not from our study but by some of the people who contributed to the study that I’m presenting. And it just looks at parents of people with different health conditions, in cancer, chronic kidney disease, things like that. And showed that parents of people with DEE had higher proportion of significant difficulties with with coping and psychosocial well being than other conditions. We’ve got high numbers and higher than other conditions as well. So if we move on to caregiver burden we have some, really lovely quotes from the study as well as doing these scales. We ask people to give examples or tell us, write to us about their experience. And I think they really give a real human component to these as opposed to just the numbers. I won’t read each one of them out you can can do that, but I expect they’re probably quite familiar to you.
So this particular scale that we’ve got here, a caregiver burden scale, looks at a number of different aspects of caring for a child. It’s looking at a number of different aspects of things you need to do to care for someone. And it asks about how much time are you spending and how difficult is it to do each of these things. So the time I think is in blue and the difficulty is in orange. I’ve just circled, the top three time things, which was personal care, other household tasks, and coordinating and managing services for their child. And the three biggest difficulty things were managing behaviour problems, communicating, and finding and arranging someone to care for your child.
These are very similar to the study of Dravet Syndrome five of those six things were the same as has been reported in other contexts. Impact on work, that’s a huge thing for lots of families. And a huge thing in the people in our cohort as well. 60 percent of people were working in paid employment. Obviously working very hard in non paid employment. Just over half of people had actually changed or left their job or been fired because of their caregiving duties. And of those, 75 percent of them would have been working were it not for their caregiving duties. So if we look just at the people who were employed in the last week, where they were asked for this scale, you’re asked about what had happened to you in the last week. So there was an average of five hours missed of work in the last week. And the proportion of work productivity impairment is a, another measure that they use where zero is no impairment and a hundred is where you’re completely prevented from doing something. And so we’re looking at numbers in the fifties there. So very significant impairment. Similar things with hours missed from activity, even more marked though. So this is all of the things you would want to do with your life outside of your caregiving duties. So an average of 23 hours in the week where you were not able to do the things that you wanted to do. And your impairment ratings well into the seventies.
So, let’s put this into context with other conditions again. From those measures I presented, we can derive measures called absenteeism and presenteeism. Absenteeism is the proportion of time you’re actually not at work. That five hours, when we take that as a proportion of the number of hours people were working, that’s about 20 percent of their time they should have been at work, that they’re not at work. And presenteeism is the impact on your ability to do your work when you’re at work. How much of the day is being interrupted even if you are actually making it to work. And that’s over half of the time. So if we look at a few other conditions where there’s severe conditions, they’re unpredictable, you may be in and out of hospital or have exacerbations of things, things like uncontrolled asthma, cystic fibrosis, the numbers are lower. The numbers are reasonably comparable to inflammatory bowel disease, but actually a lot of the data out there for other conditions the numbers are lower than for DEE. So unsurprisingly, most of these things interact. Your quality of life is lower if your caregiver burden is higher and the impact on your activity is higher. Interestingly, we didn’t see any direct correlation between the impact on work and quality of life, but that was probably because a large proportion of our cohort actually wasn’t able to work and we probably would need bigger numbers to show that. I didn’t present the data on child quality of life, but if we look both at caregiver quality of life and child quality of life, there’s a number of things in terms of the clinical factors to do with the child’s symptoms that feed into that and you’ll notice actually that seizures is not mentioned on here. And the things that seem to have the biggest impact are actually the additional symptomsother than the seizures and really it’s almost the full gamut of the other symptoms. That’s been borne out in some other studies as well. There are some studies that have shown that seizures are also a factor. Particularly if you’ve got lots of seizures or lots of days that are really interrupted by seizures. But I think the additional symptoms other than seizures being a factor really is borne out across lots of different studies.
What have we got from this study? So we’ve now got more data on a broader group of people with DEE and shown the findings really parallel those that we’ve seen in Dravet Syndrome. We’ve got more data in the Australian context, which is really important for us for advocating for, ways to improve these things. Not surprisingly, we’ve shown poor quality of life, extremely high caregiver burden and impact on work productivity and that these are all interrelated. A lot of things still to do. We can actually put some dollar values around these, which we haven’t done yet, but we will. We need to understand things about diversity among caregivers. We don’t have a lot of fathers. We don’t have a lot of very older adults caring for for their adult children. Different ethnic groups, different cultural groups, that kind of thing. We need to understand how these change over time. And we need to understand impacts on other family members. I haven’t mentioned siblings, grandparents. Other people around the child and parents and there’s big impacts there as well. Urgent need to address these impacts.
Our survey was started to look at some ways to address things really, focusing only on the health system because that I guess is what we know best. But things like the disability system, the education systems, governments as a whole all of those kind of things we still need to tackle. So we actually had a few more people complete this component of the survey, mostly the same group of people, but a few more actually finished this survey.
First of all, just to give you an idea of the magnitude and amount of health services that people are using. Almost everybody had seen more than three or more health medical professionals in the 12 months prior,to completion. The main people being Neurologists, General Practitioners, Pediatricians, that won’t surprise you. Allied Health Professionals more than half of the group was seeing three or more Allied Health Professionals and many children accessing speech pathology, OT, physiotherapy. So very, high burden of appointments and things like that. There were lots of other health professionals that people were seeing as well. You will notice the epilepsy nurse coordinators there is 27% so pretty low proportion able to access someone to coordinate their care.
The emergency service use was very high as well. 70 percent of the group had been to the emergency department in the prior 12 months. If you just look at the emergency department row in this graph you can see that the majority of the 52 people who’d been to the emergency department had been more than once and 10 of the groups, so about 20 percent had been more than 10 times in the last 12 months.
A lot of people were admitted to hospital. Of the people that were admitted, the mean length of their hospital admissions cumulatively over that 12 months, if you’d had more than one admission was 23 daysAnd if we think about the estimated costs of admission, so a day in hospital approximately $2,800. If we add all of that up purely for these people in this group who were in hospital for this 12 month period. That’s over 3 million dollars worth of hospital admission costs alone. That’s for one year and that’s for what have we got, 46 people. If we think about the incidence of DEE and think about that being about 500 newly diagnosed people in Australia each year, and then we add another 500 each year, that’s a lot of people. The cost is going to be massive. Just keep that in mind when we’re talking about, something at the end in terms of cost savings.
Despite the emergency service use being so high, the proportion of people who actually had emergency plans was quite low. The majority of people did have an emergency management plan for home. We get a lot of support from the Epilepsy Foundation with doing those. They do a wonderful job and a lot of you will know of them. That is fairly well done, but for people who are coming to hospital a lot, using ambulances a lot for complex epilepsies and may or may not have specific needs or individualised requirements or plans we’re looking at, one in five, actually having a specific documented plan for that, which can lead to delays, things not being done, the wrong things being done, having to explain over and over again to people, having to wait for someone to call the neurologist. Obviously telling you things you know, but this was actually is a real gap. We have started trying to plug that gap. We’ve developed some templates for in hospital plans. So for when you come to the ED or you’re in hospital that those things are documented.
As far as the use of health services gothis is just summing up the number of different people had seen. So you’ll see in the red bars here that allied health professionals and medical professionals, most people were seeing three or more, I mentioned that before. What we can see, though, is if we think about care coordination and mental health services, about half of people were accessing none of either, which again is a really big gap and pretty striking. We asked people what was good and bad about their experience of the health system, and people generally expressed that they were satisfied with services if their health professionals were knowledgeable and if they were compassionate.In contrast there are actually a lot of reasons why people found things difficult or were dissatisfied. You can see the list here. Some really important ones were when people were not knowledgeable and, or didn’t listen. Didn’t listen was a really big one. Lack of support, lack of feeling heard and lack of resources and long waiting times. Just a few quotes here to leave here for a second. The sort of lack of knowledge, lack of being listened to was, were recurrent themes as was the real striking need to advocate for and keep pushing for everything and coordinate everything. And this was a huge recurring theme. We asked people what their biggest priorities for improvement to aspects of the health system were. We asked people to rank their top three. And it’s come through somewhat small but each of these rows here represents a different aspect of the health system and you can see the number of people that that listed each one of those as a priority. And the ones right up the top are the emergency and hospital use. Some really important aspects of health system care, which we, really can directly address. And it’s good to know that’s a priority. Another massive one, obviously, is psychosocial support. Mental health support, social work support, respite care, all of those kinds of things. And neurologists was a really important one as well. And so we have some work to do there. Interestingly, I’ll just come back to this one slide. You can see about halfway down the list is an epilepsy nurse coordinator and people mostly didn’t prioritize that, but actually in the comments, the kinds of things that an epilepsy nurse coordinator, a DEE nurse coordinator can do actually, I think would go a long way to addressing a lot of the, problems that we’re talking about having a knowledgeable person who can support the families, support other healthcare professionals help people navigate systems, be the point of call that may end up averting some hospital presentations and things like that. And I think these quotes tell it really nicely. So we need wraparound support and coordination as a complete lack of recognition of the unpaid exhaustive time spent by parents and carers who have to learn everything, who coordinate a child’s complex health development and support plan. If that role isn’t filled, none of the services available would be sought or accessed. There is a huge aspect of this healthcare system that’s completely discounted and ignored. I suspect that probably encapsulates a lot of people’s experience. So with all of the knowledge from this study, we’re now using the findings to prioritize and guide and also evaluate improvements and changes. All of these data will be really useful to advocate for funding, to explain to people why these conditions are a problem. A lot of people don’t even know what a DEE is, let alone know how severe it is or how that compares to other conditions which they know well and can really picture in their mind as being severe conditions.
We really need the nurse coordinators, really encapsulated in these four dot points here improving patient and family satisfaction, improving healthcare professional satisfaction and things like healthcare professional. Burnout is a massive issue as well. And so while that is, not our main aim by any means in dealing with this, I think it will actually also be very helpful for us as well. It helps mean we can provide great care, which will help attract clinical trials and access to development of new therapies and also reduce healthcare costs via things like reducing emergency department presentations. If we think about what it costs to employ a DEE nurse for a year, and we think about it costing nearly 3, 000 per day in hospital. In that 46 patients we were talking about, if you divide the cost of employing someone by that nearly 3, 000, you get pretty much spot on 46. So if we took one day off per year from each of those 46 patients admission days, they had 23, if we reduced it to 22, we would pay for a DEE nurse. And I mentioned there’s heaps more than 46 people around. So that’s the kind of cost benefit type of thing we’re looking at. This is a complete no brainer from our point of view and now we need to convince other people about this. So we will keep working. Thank you so much to everyone involved and thank you all for listening. These are difficult things to listen to. They’re difficult things to convey for the people who completed this study. It’s a lot of emotional labor in trying to be a parent or caregiver for a DEE trying to change the system. And we know there was in this survey. And so I just really wanted to acknowledge that and thank you all very much.